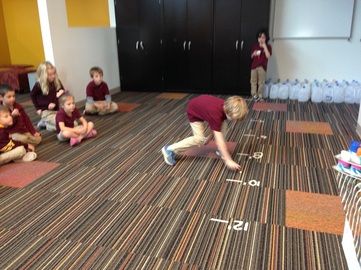
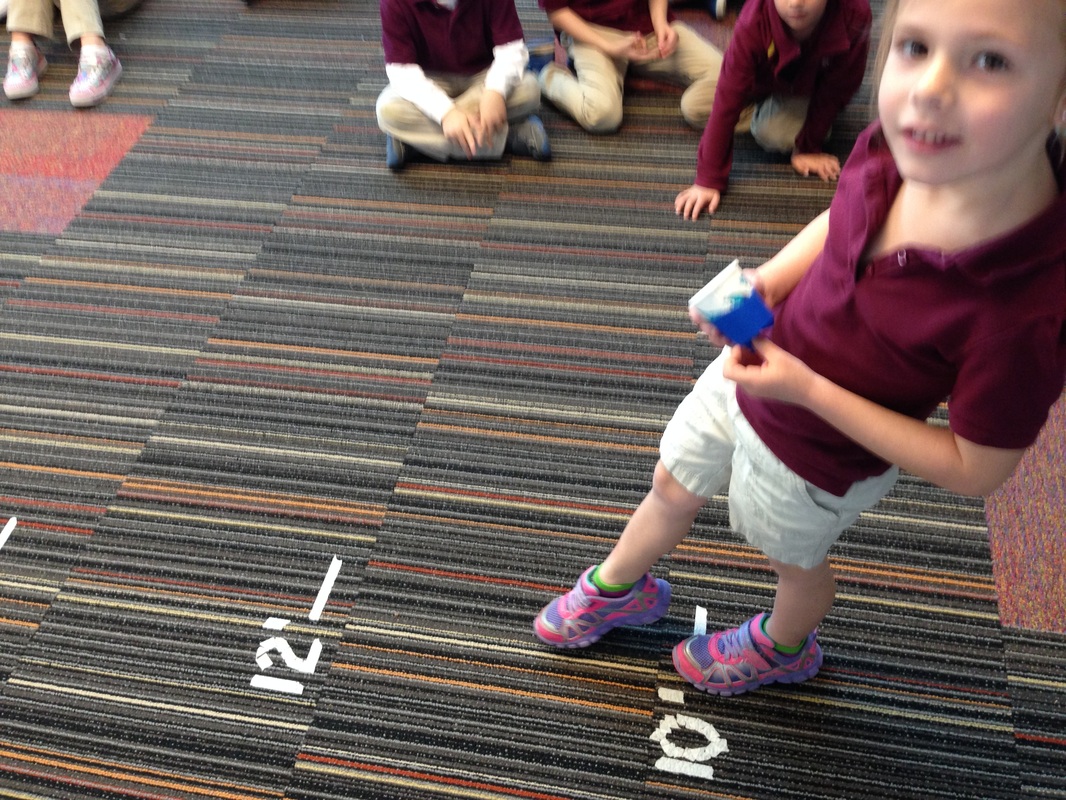
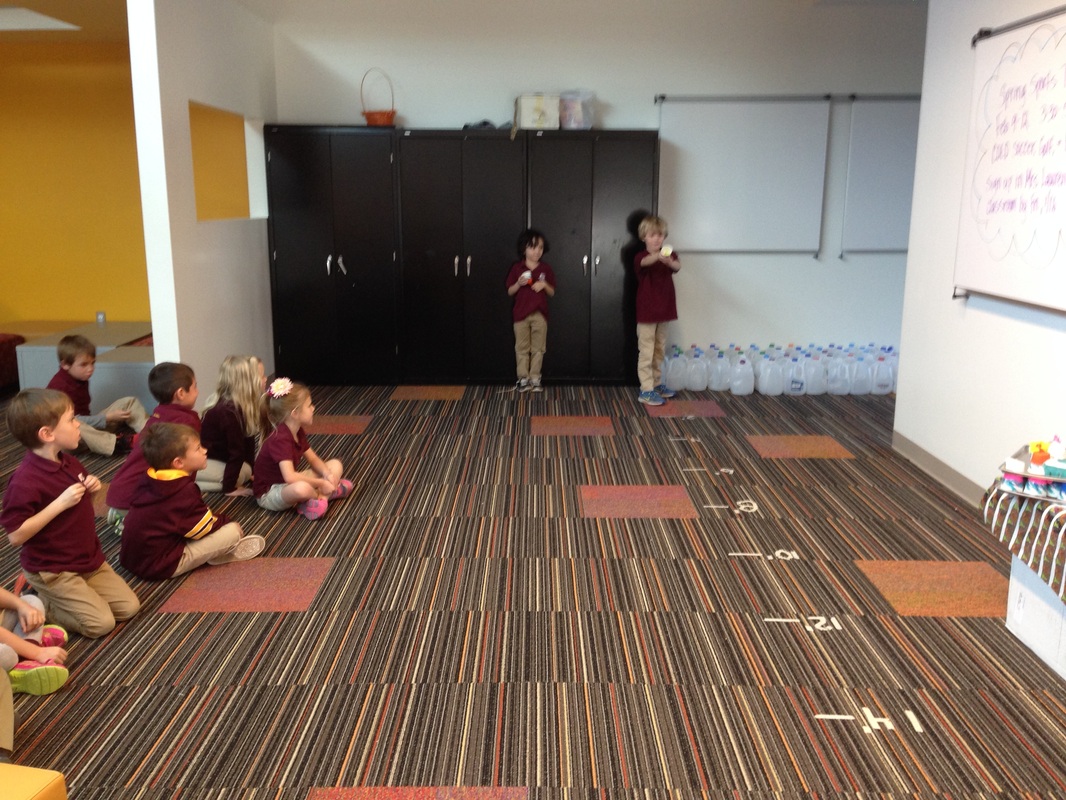
This week, the kindergarten students were introduced to graphs and graphing. We launched four different materials and measured the distance each traveled. When we went back into the lab, each student was given a graph to label. Each student labeled the x and y axis, and began coloring each bar to represent the data we collected. It was amazing how quickly the students understood how important each of the labels were on both axis. They noticed right away that the graph was missing information, and they knew what labels needed to be included.
0 Comments
Leave a Reply. |
AuthorMrs. Houseman-STEM Specialist Archives
May 2017
Categories |
 RSS Feed
